Skip to main contentWorkMoney
  • Money Savers
  • Money Tips
  • Member Benefits
  • Money Finder
  • About Us
Log inJoin
WorkMoney

About Us

  • Careers
  • Contact Us
  • In the News

Money Savers

  • Family Care
  • Food
  • Healthcare
  • Home Upgrades
  • Housing
  • Credit, Debt, & Investing
  • Taxes
  • Transit and Car
  • Phone & Utilities
  • Work

Money Tips

  • Budget 101
  • Credit 101
  • Daily Savings
  • Debt Tips
  • Family Events
  • Healthcare
  • Jobs
  • Scams
  • Taxes

Membership

  • Member Benefits
  • Member Testimonials
  • Member Login
  • Sign Up

Resources

  • Money Finder
  • Local Resource Finder
  • Search

Policies and Disclaimers

  • Privacy Policy
  • Terms
  • SMS Policy

Language

  • English
  • Spanish
  • Facebook
  • X
  • Youtube
  • Instagram
  • TikTok
© 2025– WorkMoney
Budget 101

How Much Americans Actually Spend on Food Each Month

Whether dining out or cooking at home, food is typically one of the largest line items in most American households. 

By Brett Holzhauer

9/5/25

6 min. read

Table of food with hands reaching for plates

Key takeaways

  • Food spending varies widely depending on household size, location, dietary preferences, and shopping habits—so use averages as a guide, not a rule.

  • Eating out consistently costs more than cooking at home, making meal planning and home cooking effective ways to reduce food expenses.

  • Tracking your food budget and shopping smartly—using seasonal produce, loyalty programs, and bulk buying—can help control rising food costs without sacrificing nutrition.

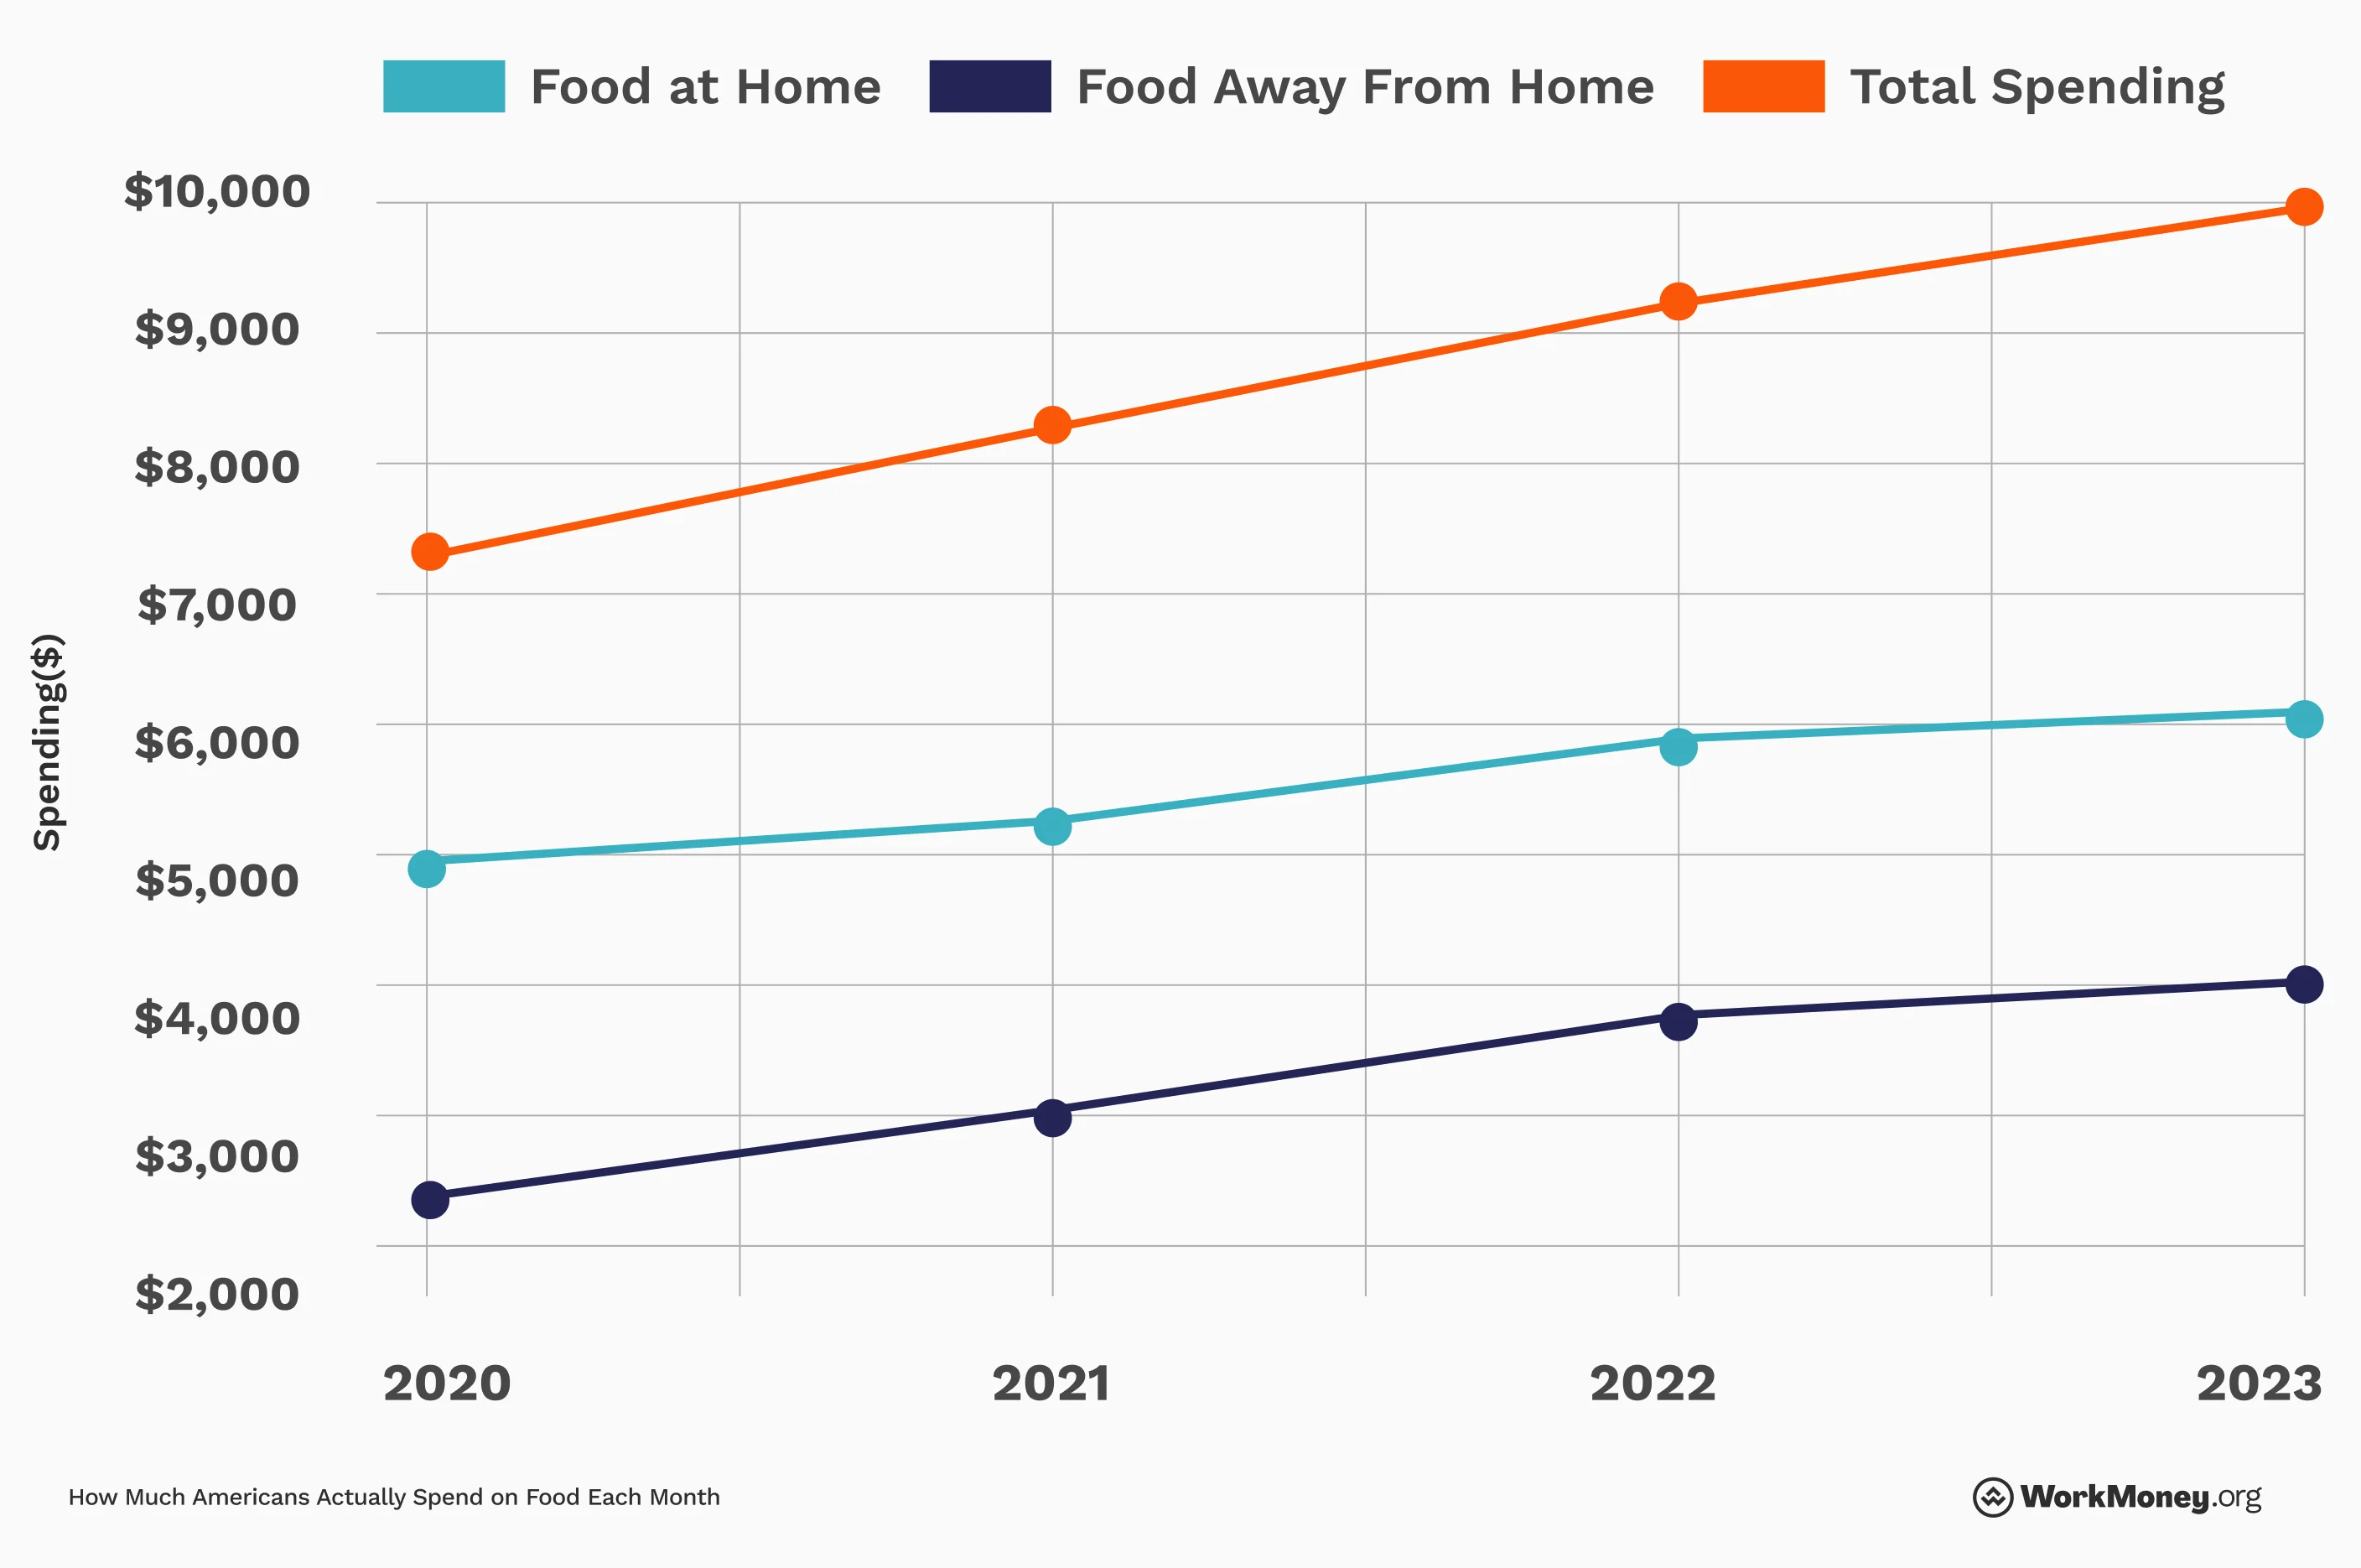
There are several estimates of how much everyday Americans spend, but these figures can vary widely based on location, shopping habits, and the types of purchases made. In 2023, the Bureau of Labor Statistics reported that the average annual expenditure on food was $9,986, or approximately $832 per month. Two years later, inflation has likely increased that number to over $10,000.

Again, this number can vary widely. It’s wise to use these numbers as a barometer of where you sit based on your food spending habits.

The WorkMoney team is here to help readers understand if they are on track with their spending and what they can do to help bring it down without major sacrifices.

Monthly expenses chart throughout the years - shows 2020 - 2023

The Bottom Line

Averages are a great way to measure what you’re spending compared to others. However, don’t give it too much weight. Everyone has different situations, including dietary intake, income, and more.

More importantly, focus on your own physical and financial well-being. By getting your grocery shopping habits and budget aligned, you can continue to build towards a bright future ahead.


About the Author

Brett Holzhauer

Brett Holzhauer

Brett Holzhauer is a Certified Personal Finance Counselor (CPFC) who has reported for outlets like CNBC Select, Forbes Advisor, LendingTree, UpgradedPoints, MoneyGeek and more throughout his career. He is an alum of the Walter Cronkite School of Journalism at Arizona State. When he is not reporting, Brett is likely watching college football or traveling.

X
LinkedIn

Related Articles

Every dollar counts. See how to stretch yours.

Two people smiling while putting bananas and oranges in a mesh bag in front of other produce

Suggested read

How to shop for groceries on a budget

Find several ways you can win the fight against high food prices for you and your family

A woman with dark hair looking down at a tablet while standing in a pantry with shelves of food items

Shrinkflation: Are your groceries shrinking?

Do you feel like some of your groceries are getting…smaller?

Other Ways to Save Money

Unlock savings opportunities in every corner of life.

Top money-saver

Find local free food pantries

Discover free food resources in your neighborhood.

See solution

Get paid to grocery shop

Earn cash back on every grocery run with the Upside app

See solution
  • Deeper Dive: Food Costs by Household Size (USDA Estimates)

    The costs listed above are estimates for households with four people. Here are more specific estimates for the cost of feeding someone based on age, gender, and budget on a weekly basis in April 2025, according to the USDA.

    Age

    Low-Cost Plan Weekly

    Low-Cost Plan Monthly

    Moderate-Cost Plan Weekly

    Moderate-Cost Plan Monthly

    Liberal Plan Weekly

    Liberal Plan Monthly

    Child:

    1 year

    $36.20

    $156.90

    $40.90

    $177.00

    $49.70

    $215.30

    2-3 years

    $38.00

    $164.90

    $45.80

    $198.40

    $55.70

    $241.50

    4-5 years

    $39.50

    $171.00

    $48.60

    $210.60

    $59.10

    $256.00

    6-8 years

    $57.10

    $247.40

    $67.00

    $290.20

    $78.40

    $339.90

    9-11 years

    $59.90

    $259.70

    $76.80

    $332.60

    $89.50

    $387.70

    Female:

    12-13 years

    $59.50

    $258.00

    $70.60

    $306.00

    $88.30

    $382.40

    14-18 years

    $59.90

    $259.50

    $71.50

    $309.80

    $88.30

    $382.80

    19-50 years

    $61.10

    $264.90

    $74.40

    $322.20

    $94.70

    $410.30

    51-70 years

    $59.40

    $257.40

    $73.30

    $317.70

    $87.90

    $380.80

    71+ years

    $59.30

    $257.00

    $72.70

    $315.00

    $86.70

    $375.60

    Male:

    12-13 years

    $70.10

    $303.70

    $86.90

    $376.40

    $101.80

    $441.10

    14-18 years

    $71.40

    $309.20

    $89.30

    $387.00

    $103.90

    $450.00

    19-50 years

    $70.40

    $304.90

    $88.30

    $382.80

    $107.50

    $465.70

    51-70 years

    $66.00

    $286.10

    $83.10

    $360.00

    $98.90

    $428.70

    71+ years

    $65.60

    $284.20

    $80.40

    $348.40

    $98.90

    $428.40

    This chart is a great way to map your spending each week and month based on your available budget. And if your available budget isn’t meeting those needs, you may consider looking into assistance programs like SNAP or WIC.

  • Why Food Costs Can Vary So Much

    No two people have the same food expenses. Several variables make the monthly expense fluctuate, including:

    • Dietary Habits: Organic, specialty, and meat-heavy diets usually cost more than conventional, plant-based options. If you’re looking to save, consider going meatless. A recent press release from the Physicians Committee for Responsible Medicine said going vegan could save up to $650 per year.

    • Location: Food prices vary by state, city, and even neighborhood based on the cost of living and store access. You can get a sense of how much groceries cost in your state here.

    • Shopping Habits: Where and how you shop—discount stores vs. specialty markets, use of sales and coupons—affects your bill.

    • Cooking vs. Dining Out: Eating out costs significantly more than cooking at home, especially over time.

    • Food Waste: Spoiled groceries and uneaten leftovers mean wasted money. Meal planning can help reduce this.

    • Economic Factors: Inflation, supply chain issues, and weather events can all raise food prices unexpectedly.

  • Strategies to Take Control of Your Food Spending

    Meal Plan

    Start by creating weekly menus and detailed shopping lists. Planning your meals helps you avoid impulse buys and ensures you only purchase what you need. It also makes cooking less stressful and helps you make the most of ingredients throughout the week.

    Shop Smart

    Be a savvy shopper by comparing prices between stores and opting for seasonal produce, which tends to be fresher and cheaper. Take advantage of loyalty programs and coupons to get discounts, and consider buying non-perishable items in bulk to reduce costs over time.

    Consider using Upside to earn cash back on purchases you would normally make, and Instacart for specials to have your groceries delivered.

    Cook at Home More

    Home-cooked meals are generally healthier and much more budget-friendly compared to dining out or ordering takeout. Plus, cooking can be a fun way to try new recipes and improve your culinary skills.

    Track Your Spending By Budgeting

    Keeping track of what you spend on food helps you stay aware of your habits and identify areas where you can cut back. Use budgeting apps or simple spreadsheets to record purchases and analyze your food expenses regularly. Additionally, set a target amount for your food spending that fits your lifestyle and income. Having a clear budget helps you make mindful choices and stick to your goals without feeling deprived.

  • American Household Grocery Bill Data

    At the time of publishing this article, we don’t have official data yet for 2024, so we’re going off 2023 numbers. So for each of these numbers, estimate just slightly higher to account for modest inflation in the last two years.

    Here’s what the data from the Bureau of Labor Statistics shows from 2023, and how that has increased in recent years.


    2020

    2021

    2022

    2023

    Food at home

    $4,935

    $5,259

    $5,703

    $6,053

    Food away from home

    $2,375

    $3,030

    $3,639

    $3,933

    Total spending

    $7,310

    $8,289

    $9,342

    $9,986

    From 2020 to 2023, food expenses went up a whopping 36%. This means that since the onset of the Covid-19 pandemic, Americans are likely now spending 40% more on food compared to just five years ago. So if you see your grocery bill rising, it’s not just you.